Setting up Heatmaps with Sigmize
Setting up Heatmaps for your experiment is easy, allowing you to view visitor behavior on the page directly within Sigmize.
Setup Heatmaps
- To set up Heatmaps, click on the “Create Experiment” option located on the right side of your Sigmize dashboard.

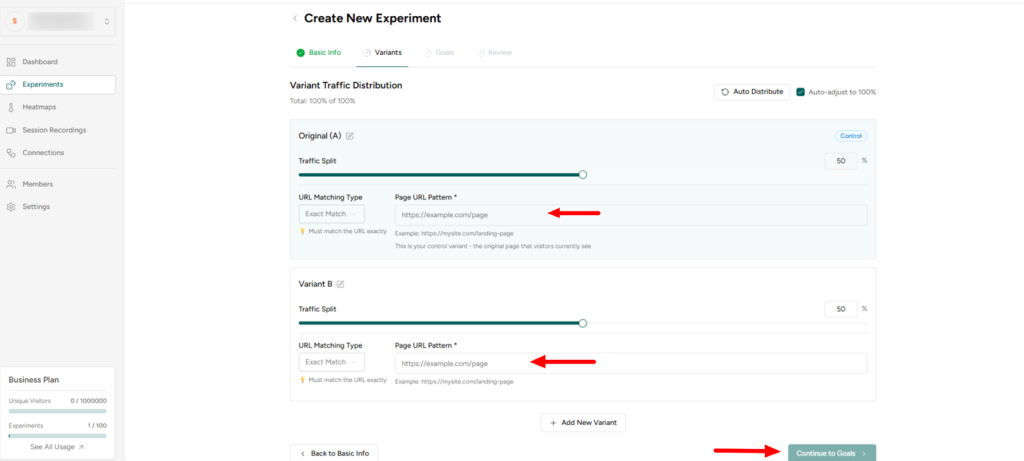
- Enter the experiment details and click “Continue to Variants.”

- Add your page URL, adjust the traffic distribution, and click “Continue to Goals.”

- Now, choose your conversion goal parameters. At the bottom, enable the Heatmaps option, then click “Review & Save.”

The heatmaps option will be added to your experiment once it’s Live.
If you have an ongoing experiment and forgot to enable Heatmaps, you can manually tick the option as shown below.
Setup Heatmaps for existing Experiments
- Select the Experiment displayed on the left side of your Sigmize dashboard.

- Next, select the experiment you want to add Heatmaps to, click on the three dots on its right, and choose Settings.

- A pop-up will appear, where you can now enable Heatmaps

This will enable Heatmaps in case you forgot to add it during the initial experiment setup.
How to view Heatmaps?
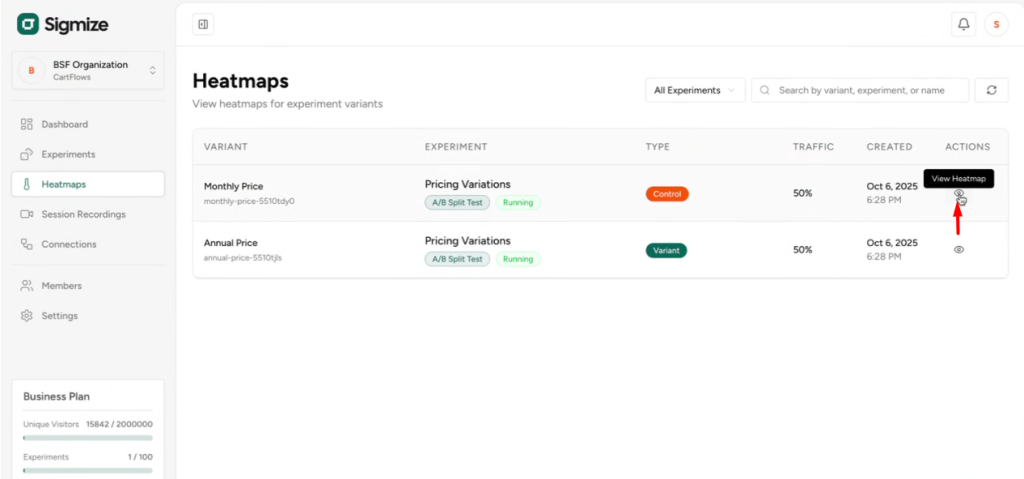
- To view Heatmaps for any visitor, click on Heatmaps on the left side of your Sigmize dashboard.

- You can now view the behavior for any session by clicking the View Heatmaps button displayed to the right of the session.

That’s how you can track visitor behavior on your page.
We hope this guide helps you set up and view heatmaps.
If you need any assistance, feel free to contact our support team.
We don't respond to the article feedback, we use it to improve our support content.
